How-to Manage Logs Using Graylog?

The Graylog
Graylog is a powerful log management and analysis tool that has many use cases, from monitoring SSH logins and unusual activity to debugging applications. It is based on Elasticsearch, Java, and MongoDB.
It also allows you to search and visualize a large variety of logs in a web interface. but we will limit the scope of this tutorial to syslog gathering.
Graylog Components and Architecture
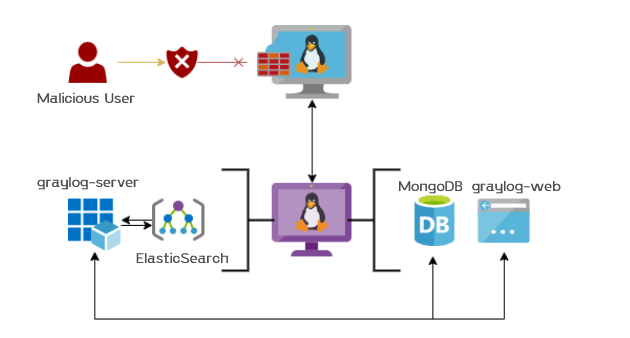
Every Graylog System is composed of at least one instance of Graylog Server, MongoDB and Elasticsearch. Each of these components are required and cannot be substituted with any other technology.
- Graylog Server nodes: Serves as a worker that receives and processes messages, and communicates with all other non-server components. Its performance is CPU dependent
- Elasticsearch nodes: Stores all of the logs/messages. Its performance is RAM and disk I/O dependent
- MongoDB: Stores metadata and does not experience much load
- Web Interface: The user interface
Here is a diagram of the Graylog components and architecture:
Setup: Graylog Server
Installing Java
Elasticsearch requires Java version 8 or higher. We will use OpenJDK or Oracle JDK on Graylog machine to proceed further.
Update your apt package database:
sudo apt update
Install the stable version of OpenJDK 11 with this command (and accept the license agreement that pops up):
sudo apt install openjdk-11-jre-headless
Now that Java is installed, let’s install Elasticsearch.
Installing Elasticsearch
Elasticsearch store logs coming from external sources and offers real-time distributed search and analytics with the RESTful web interface. Elasticsearch can be installed with a package manager by adding Elastic’s package source list.
Run the following command to import the Elasticsearch public GPG key into apt:
sudo wget -qO - https://packages.elastic.co/GPG-KEY-elasticsearch | sudo apt-key add -
If your prompt is just hanging there, it is probably waiting for your user’s password (to authorize the sudo command). If this is the case, enter your password.
Create the Elasticsearch source list:
sudo echo "deb https://artifacts.elastic.co/packages/oss-6.x/apt stable main" | sudo tee -a /etc/apt/sources.list.d/elastic-6.x.list
Update your apt package database and then install the Elasticsearch package
sudo apt update
sudo apt install -y elasticsearch-oss
Elasticsearch is now installed. Let’s edit the configuration file to set the cluster name for Graylog set up.
sudo nano /etc/elasticsearch/elasticsearch.yml
Find the section that specifies cluster.name. Uncomment it, and set the cluster name as “graylog", so it looks like the following
/etc/elasticsearch/elasticsearch.yml:
...
cluster.name: graylog
...
Then, add the following line at the end of the file.
action.auto_create_index: false
Start the Elasticsearch service to read the new configurations and run the following commands to start Elasticsearch on boot up:
sudo systemctl daemon-reload
sudo systemctl start elasticsearch
sudo systemctl enable elasticsearch
Now that Elasticsearch is up on port 9200 and running, let’s install the MongoDB server.
Installing MongoDB
MongoDB acts as a database for storing Graylog’s configuration. So, we will install MongoDB from the Ubuntu base repository.
sudo apt update
sudo apt install -y mongodb-server
Start the MongoDB and enable it on the system start-up.
sudo systemctl start mongodb
sudo systemctl enable mongodb
MongoDB should be up and running now. Let’s move on to installing Graylog server.
Installing Graylog
Graylog Server reads data from Elasticsearch for search queries comes from users and then displays it for them through the Graylog web interface.
Now install the Graylog repository configuration and Graylog itself with the following commands:
wget https://packages.graylog2.org/repo/packages/graylog-4.0-repository_latest.deb
sudo dpkg -i graylog-4.0-repository_latest.deb
sudo apt-get update && sudo apt-get install graylog-server graylog-enterprise-plugins graylog-integrations-plugins graylog-enterprise-integrations-plugins
Install pwgen, which we will use to generate password secret keys:
sudo apt-get install pwgen
We must set a secret to secure the user passwords. Use the pwgen command to generate the secret.
pwgen -N 1 -s 96
Edit the server.conf file.
sudo nano /etc/graylog/server/server.conf
Then, place the secret like below.
/etc/graylog/server/server.conf:
...
password_secret = XXXXXXXXXXXXXXXXXXXXXXXXXXXXXXXXXXXXX
...
Now, generate a hash (sha256) password for the root user (not to be confused with the system user, the root user of graylog is admin).
To create your root_password_sha2 run the following command:
echo -n "Enter Password: " && head -1 </dev/stdin | tr -d '\n' | sha256sum | cut -d" " -f1
Edit the server.conf file again.
/etc/graylog/server/server.conf:
...
root_password_sha2 = XXXXXXXXXXXXXXXXXXXXXXXXXXXXXXXXXXX
...
The last step is to enable Graylog during the operating system’s startup and verify it is running.
sudo systemctl daemon-reload
sudo systemctl enable graylog-server.service
sudo systemctl start graylog-server.service
sudo systemctl --type=service --state=active | grep graylog
The next step is to ingest messages into Graylog and extract the messages with extractors or use the Streams to work with the messages.
Configuring graylog-web Interface
So now we will be connecting to Graylog over HTTP. To configure the web interface we need to set two further options in the same server.conf file. These options are; “http_bind_address” and “http_external_uri”.
Get the IP of your server with the ip address cmd, then paste it into the location shown below and make sure the the line doesn’t have a ‘#’ at the start of the line meaning they are commented out. If the ‘#’ is there remove it.
sudo nano /etc/graylog/server/server.conf
Update the below entry with your system IP address by which you will access the Graylog web interface. Also, to access the Graylog using public IP address due to NATing, update the http_external_uri value.
/etc/graylog/server/server.conf:
...
http_bind_address = {IP_ADDRESS}:9000
http_external_uri = http://{IP_ADDRESS}:9000/
...
All that’s left to do is start and configure graylog to enable at startup.
sudo systemctl daemon-reload
sudo systemctl start graylog-server
sudo systemctl enable graylog-server
Configuring Graylog to Receive Rsyslog Messages
The Graylog web interface will now be listening on port 9000. When we visit http://{IP_ADDRESS}:9000 in browser, we'll see a login page. We can use admin for username, and use the password we entered in previous steps.
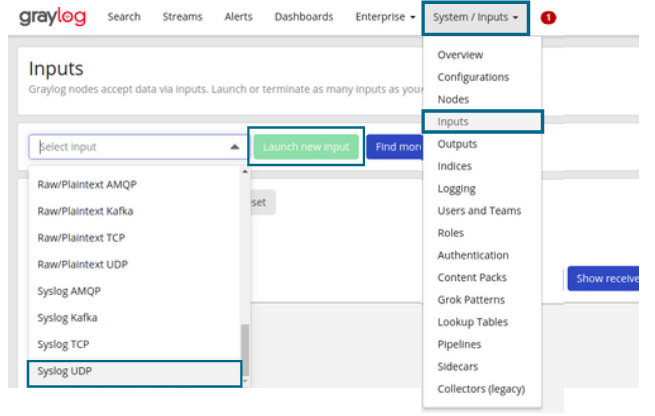
Let’s add a new input to Graylog to receive logs. Inputs tell Graylog which port to listen on and which protocol to use when receiving logs. We ’ll add a Syslog UDP input, which is a commonly used logging protocol.
To view the inputs page, click the System dropdown in the navigation bar and select Inputs. We’ll then see a dropdown box that contains the text Select Input. Select Syslog UDP from this dropdown, and then click on the Launch new input button.
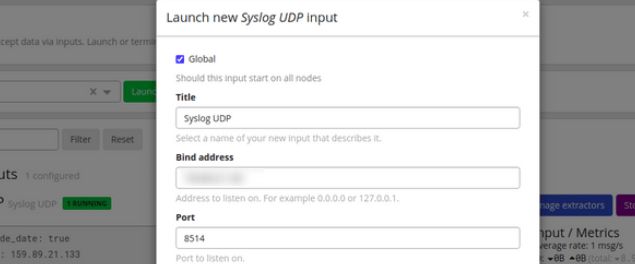
A “Launch a new input: Syslog UDP” modal window will pop up. Enter the following information (substitute in your server’s private IP address for the bind address):
- Title: Syslog UDP
- Port: 8514
- Bind address: {IP_ADDRESS} (graylog-server private IP)
Then click Launch. We should now see an input named “Syslog UDP” in the Global inputs section (and it should have a green box that says “running” next to it), like so:

Now our Graylog server is ready to receive rsyslog messages on port 8514 from our servers. Let’s configure our servers to send their rsyslog messages to Graylog now.
Configure: Graylog Agent
Configuring Rsyslog to Send Syslogs to Graylog Server
We have an input configured and listening on port 8514, but we are not sending any data to the input yet, so we won’t see any results. rsyslog is a software utility used to forward logs and is pre-installed on Ubuntu, so we’ll configure that to send logs to Graylog.
Create an rsyslog configuration file in /etc/rsyslog.d. We will call ours 90-graylog.conf:
sudo nano /etc/rsyslog.d/90-graylog.conf
In this file, add the following lines to configure rsyslog to send syslog messages to our Graylog server
/etc/rsyslog.d/90-graylog.conf:
$template GRAYLOGRFC5424,"<%pri%>%protocol-version% %timestamp:::date-rfc3339% %HOSTNAME% %app-name% %procid% %msg%\n"
*.* @**{GRAY_LOG_SERVER_IP_ADDRESS}**:8514;GRAYLOGRFC5424
Save and quit. This file will be loaded as part of our rsyslog configuration from now on. Now we need to restart rsyslog to put your change into effect.
sudo service rsyslog restart
Save and quit. This file will be loaded as part of our rsyslog configuration from now on. Now we need to restart rsyslog to put your change into effect.
Now we we know we can connect let’s enable the firewall on client.
Enabling UFW
At this point, we should allow all of the connections that your server needs to respond to. Firstly, allow the SSH port (22) we need for connecting to server. Because if we are enable UFW directly disrupt existing SSH connections.
sudo ufw allow 22
We set up a firewall rule that allows SSH connections, so it should be fine to continue.
Also, if we want to send data to Graylog from other servers, we need to add a firewall exception for UDP port 8514.
sudo ufw allow 22
To deny all incoming connections and enable UFW, use this command:
sudo ufw default deny incoming && sudo ufw enable
We will receive a warning that says the command may disrupt existing SSH connections. Respond to the prompt with y and hit ENTER. The firewall is now active.
We can repeat these steps for each server we want to send logs from.
Manage: Graylog Server
Creating Extractors on Graylog Server
Graylog Extractors can extract data using regular expressions, Grok patterns, substrings, or even by splitting the message into tokens by separator characters. The extractors can be used reformat logs or to make the logs more structured and searchable.
To create an extractors for a specific input, Navigate to System > Inputs and click on Manage Extractors.

We can also create an extractor for a specific message from Graylog search dashboard by clicking on the message as shown in the screenshot below;

If we launched the extractor from Inputs section, click Get Started and Load Message from the selected input.

We are going to use Grok pattern to extract fields on UFW action logs, as highlighted above and proceed to create the grok pattern to extract various fields in our message.
A sample UFW action log message is;
[272143.751893] [UFW BLOCK] IN=eth0 OUT= MAC=16:53:39:f5:17:f3:fe:00:00:00:01:01:08:00 SRC=45.129.33.40 DST=138.68.85.5 LEN=40 TOS=0x00 PREC=0x00 TTL=250 ID=5685 PROTO=TCP SPT=43567 DPT=20646 WINDOW=1024 RES=0x00 SYN URGP=0
This is the grok pattern for the message used in UFW logs.
\[%{DATA}\] \[UFW %{WORD:ufw_action}\] IN=%{DATA:ufw_interface} OUT= MAC=%{DATA:ufw_mac} SRC=%{IP:ufw_src_ip} DST=%{IP:ufw_dest_ip} LEN=%{INT:ufw_pack_len} TOS=%{DATA:ufw_tos_data} PREC=%{DATA:ufw_prec_data} TTL=%{INT:ufw_ttl_data} ID=%{DATA:ufw_id_data} PROTO=%{WORD:ufw_protocol}(%WINDOW=%{DATA:ufw_window_data})?(%RES=%{DATA:ufw_res_data})?(%{WORD:ufw_packetsynack})?(%URGP=%{DATA:ufw_urgp_data})? SPT=%{INT:ufw_src_port} DPT=%{INT:ufw_dest_port}
We can test our grok pattern by clicking try against your message. If all is well, then we should see our UFW fields extracted.
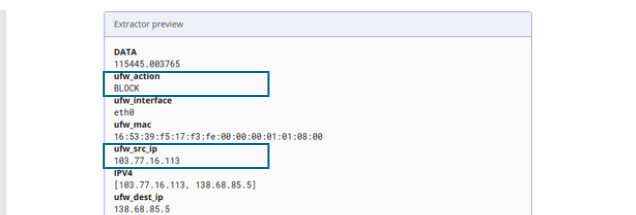
Next, set the title of the extractor and save it.
After that, navigate to the Graylog search dashboard and our UFW log messages should now have the correct fields as defined by the extractor.

Creating Extractors for sshd logs
To create an extractors for a specific input, Navigate to System > Inputs and click on Manage Extractors.

If we launched the extractor from Inputs section, click Get Started and Load Message from the selected input.

We are going to use Grok pattern to extract fields on SSHD logs, as highlighted above and proceed to create the grok pattern to extract various fields in our message.

A sample SSHD action log message is;
Failed password for root from 95.214.112.35 port 40182 ssh2
The grok pattern for the message used in SSHD logs to search for recently failed SSH login usernames:
Failed %{WORD:sshd_auth_type} for %{USERNAME:sshd_invalid_user} from %{IP:sshd_client_ip} port %{NUMBER:sshd_port} %{WORD:sshd_protocol}
The grok pattern for the message used in SSHD logs to search for recently failed SSH invalid login usernames:
Failed password for invalid user %{USERNAME:sshd_invalid_user} from %{IP:sshd_client_ip} port %{NUMBER:sshd_port} %{WORD:sshd_protocol}
The grok pattern for the message used in SSHD logs to search for recently successful SSH login usernames:
(?<sshd_result>Accepted) %{WORD:sshd_auth_type} for %{USERNAME:sshd_user} from %{IP:sshd_client_ip} port %{NUMBER:sshd_port} %{WORD:sshd_protocol}
We can test our grok pattern by clicking try against your message. If all is well, then we should see our SSHD fields extracted.

Next, set the title of the extractor and save it.
After that, navigate to the Graylog search dashboard and our SSHD log messages should now have the correct fields as defined by the extractor.

Creating Stream For SSHD Logs
The Graylog streams are a mechanism to route messages into categories in realtime while they are processed. We define rules that instruct Graylog which message to route into which streams.
Navigate to the streams section from the top navigation bar. Click “Create stream”.
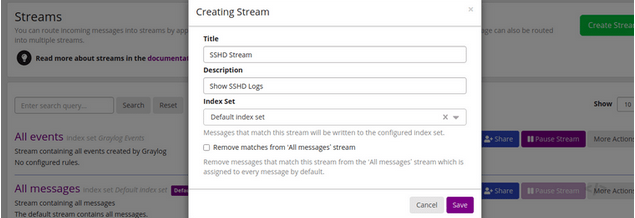
Add stream rules, by indicating the field that we want to check, and the condition that should satisfy. Once we are satisfied with the results, click on “I’m done”.
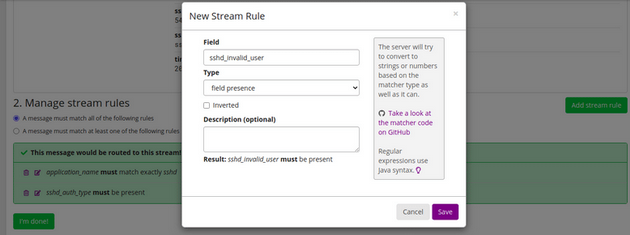
SSHD Stream rules we have configured:
- application_name must match exactly sshd
- sshd_auth_type must be present (field presence)
- sshd_invalid_user must be present (field presence)
Creating Stream For SSHD Logs
The Graylog streams are a mechanism to route messages into categories in realtime while they are processed. We define rules that instruct Graylog which message to route into which streams.
Navigate to the streams section from the top navigation bar. Click “Create stream”.

Add stream rules, by indicating the field that we want to check, and the condition that should satisfy. Once we are satisfied with the results, click on “I’m done”.
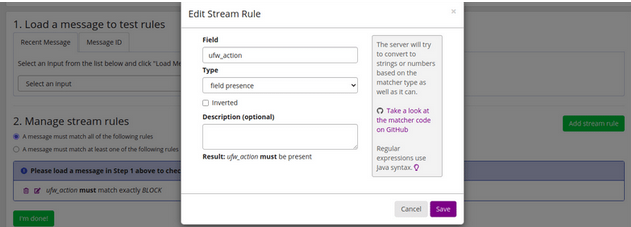
UFW Stream rules we have configured:
- ufw_action must be present (field presence)
The streams is still paused, click on the “Start stream” button to activate the streams.
Using dashboards allows you to build pre-defined searches on your data to always have everything important just one click away.
Sometimes it takes domain knowledge to be able to figure out the search queries to get the correct results for your specific applications. People with the required domain knowledge can define the search queries once to share them with co-workers, managers, or even sales and marketing departments.
Creating Dashboard For SSHD Logs
Navigate to the Dashboards section using the link in the top menu bar of your Graylog web interface. The page is listing all dashboards that we are allowed to view. Hit the Create new dashboard button to create a new empty dashboard.

We should now see our new dashboard. Hit the Save as button on the right side of the search bar to save the dashboard.
This will open a modal where we can define a title, summary and description.
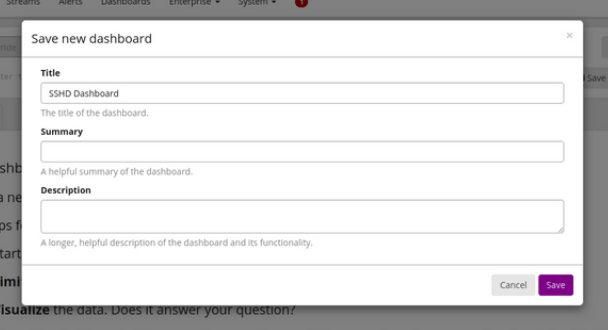
Next, we will be adding widgets to the dashboard we have just created.
Widget specific search criteria
Dashboard's includes the time range, search query and stream selection. These options can be defined using the search bar inside the widget edit modal.
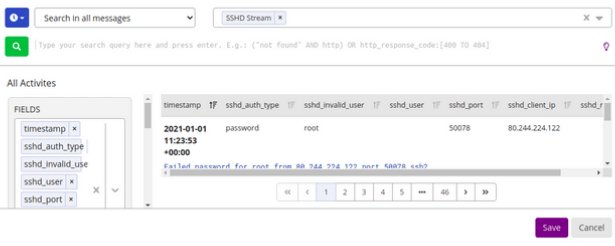
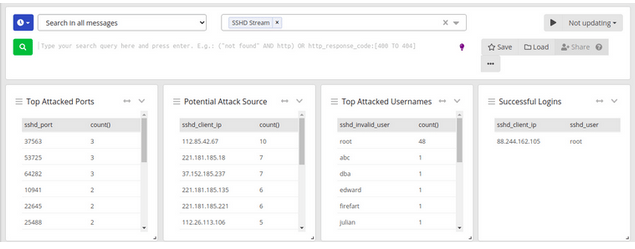
Let’s listing for top attacked usernames and ports, attack source ips and successfull logined users within the all times. To do this, click Fields, select related fields, and select "Show top values" where the menu is opened. This actions will generate a new Widget containing a data table where the fields value are listed in the rows and the count of occurrence will be displayed next to it.
Creating Dashboard For UFW Logs
Navigate to the Dashboards section using the link in the top menu bar of your Graylog web interface. The page is listing all dashboards that we are allowed to view. Hit the Create new dashboard button to create a new empty dashboard.

We should now see our new dashboard. Hit the Save as button on the right side of the search bar to save the dashboard.
This will open a modal where we can define a title, summary and description.
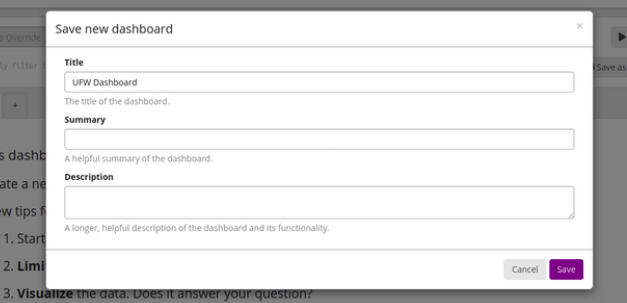
Next, we will be adding widgets to the dashboard we have just created.
Widget specific search criteria
Dashboard's includes the time range, search query and stream selection. These options can be defined using the search bar inside the widget edit modal.
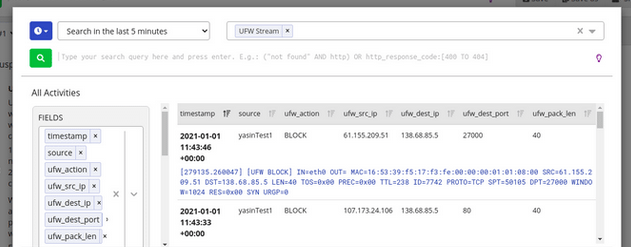
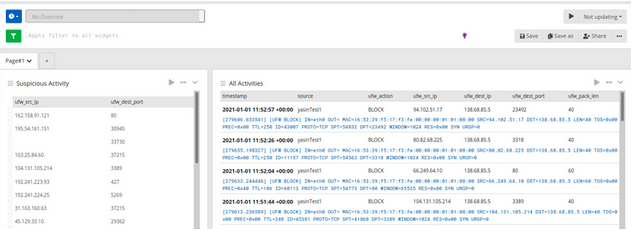
Let’s listing for blocked actions and suspicious activities within the all times. To do this, click Fields, select related fields, and select "Show top values" where the menu is opened. This actions will generate a new Widget containing a data table where the fields value are listed in the rows and the count of occurrence will be displayed next to it.
Result
We should now see widgets on our dashboard.
References
- https://www.itzgeek.com/how-tos/linux/ubuntu-how-tos/how-to-install-graylog-on-ubuntu-20-04.html
- https://www.digitalocean.com/community/tutorials/how-to-manage-logs-with-graylog-2-on-ubuntu-16-04
- https://www.digitalocean.com/community/tutorials/how-to-set-up-a-firewall-with-ufw-on-ubuntu-18-04
- https://docs.graylog.org/en/1.2/pages/getting_started/create_dashboard.html
- https://docs.graylog.org/en/4.0/pages/searching/widgets.html
- https://kifarunix.com/create-squid-logs-extractors-on-graylog-server/
- https://github.com/nxhack/logstash/blob/master/patterns/sshd
- https://github.com/reighnman/Graylog_GROK_Pattern_Collection/blob/master/content_pack.json
